
PLAN WITH CLARITY. SELL WITH CONFIDENCE. TRACK RESULTS WITH CONSISTENCY AND EASE.
PRICING SOLUTIONS TO IMPROVE COMPANY PROFITABILITY
-

-

overview
Vistaar Technologies was created to address the top challenge that persistently confounds even the best-run businesses: consistently meeting both revenue and profitability targets.
Today, it delivers leading-edge price and promotion software to some of the biggest names in global business across the verticals like beverage and alcohol, consumer goods, manufacturing and life sciences with some marquee.
-

brief
Pricing strategies for organisations are decided collaboratively by various departments like marketing, finance, sales and pricing teams. The factors that affect pricing strategies are varied and intelligence needs to be gathered from multiple sources. There are billions of data points that has to be visualised and represented.
Fractal Ink was entrusted to design a platform that makes the user experience of this complex ecosystem intuitive and frictionless.
-

challenge
The challenges in the design of this platform is manifold. Sencha, the framework that the platform uses, while being powerful in some ways is restrictive when it comes to visual language.
Scenario planning was a big and necessary functionality for which there are very few benchmarks and it needed to be designed ground up.
With billions of data points, data modelling and visualisation was a key activity.
-

strategy
We went back to the basics of user centred design to be able to make a difference with this product.
The objective of the platform was to aid decision making, which were made through collaboration with the help of insights from data. Our approach was to understand and decide when to reveal and hide relevant data seamlessly to enable informed decision making.
We also worked on models for digital interaction and collaboration to make it easy for people from different geographies to work together.
-

innovation
Innovation came from simplifying complexity. There were three aspects that we concentrated on
- Task based workflows designed for each user type providing in-line guidance throughout the pricing and sales process
- the simplification of data through data visualisation
- Providing actionable insights through analytics from historical data and market intelligence.
We designed different versions of the product for each of industries it serves accommodating for its particular needs.

BEVERAGE AND ALCOHOL
Leading players like Beam, Pernod, Sazerac and Glazers use the platform to manage the high volumes of diverse products at different price points in a highly regulated and competitive market. The product allows the users to price locally by being sensitive to geographical needs.
CONSUMER GOODS
These manufacturers are constantly faced with the challenge of balancing market share and maximising margins, with price and trade promotions being the 2 major levers. Managing these two levers involves cross-functional decisions which is enabled by SmartTrade, a product that is uniquely equipped to handle the inherent complexity of consumer goods pricing.

MANUFACTURING
The manufacturing sector faces unique challenges such as fluctuations in commodity pricing, globalisation and government policies. SmartQuote helps to identify and retain the most profitable clients while mitigating customers with churn risk. Its pricing strategy recommendations take into account market conditions and government trade policies.

RETAIL PHARMACY
Pharmacies are locked in a 3-way price squeeze between pharma companies, 3rd party insurers and trying to optimize prices while increasing sales and profits. The platform provides accurate forecasts using robust analytics and scenario planning to model the impact of proposed price changes on volume, margin and third party metrics.

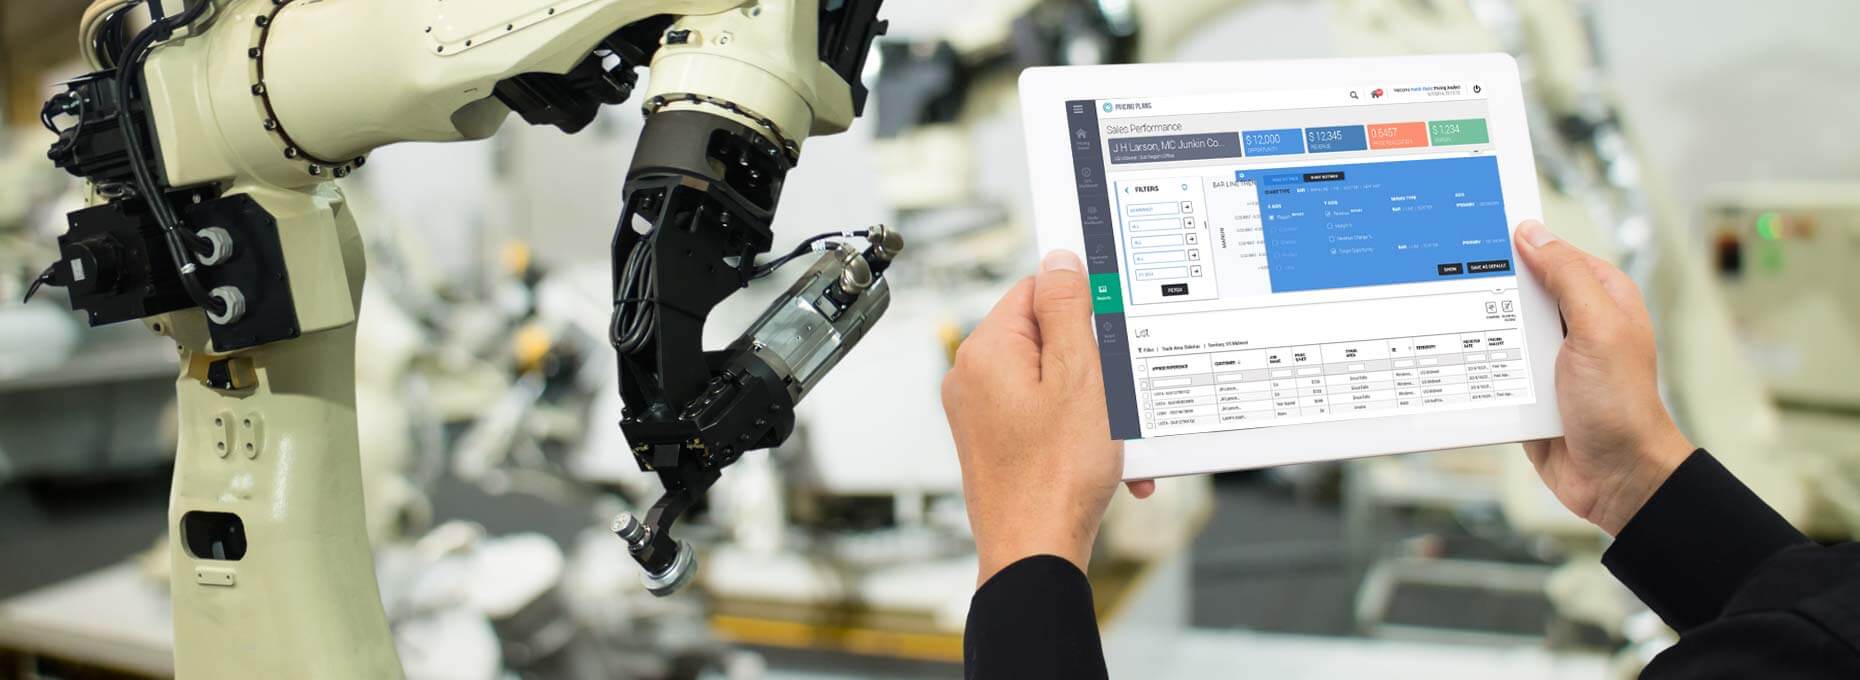
MANUFACTURING LEVEL DIGITAL INTERVENTION
The software not only helps the CXOs and marketeers to take decisions on pricing but also helps managers at the shop level to effectively look at productivity and contribute to companys revenue decisions.
MANUFACTURING LEVEL DIGITAL INTERVENTION
The software not only helps the CXOs and marketeers to take decisions on pricing but also helps managers at the shop level to effectively look at productivity and contribute to companys revenue decisions.

WITH THOUGHT AND CARE
-
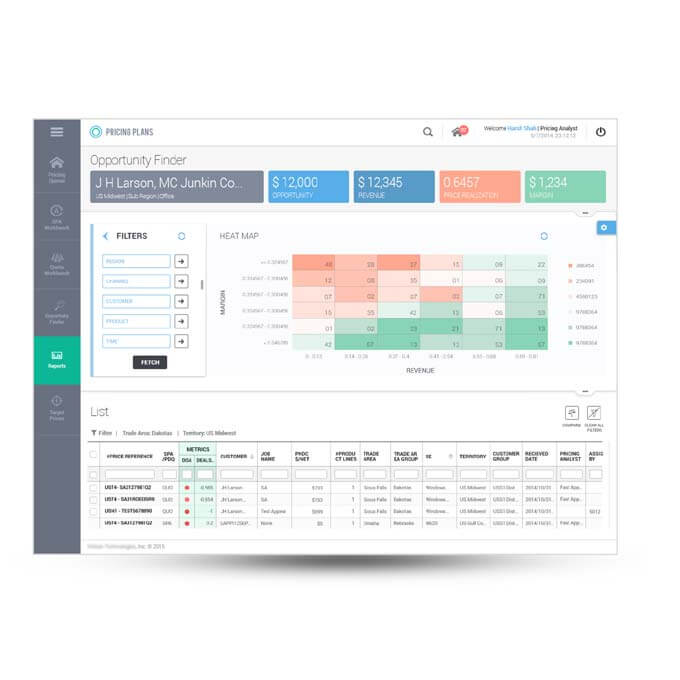
DATA REPRESENTATION
We used heat maps to effectively convey a multitude of data and its meaning. These heat maps can be customized by adding a variety of filters.
Decision making from manufacturing floor level to CXOs becomes easier when data presented is visualized in a palatable form. Heat maps are easy to read and users in this context are used to seeing.
-
QUICK CUSTOMISATION
The dynamic nature of the decision making requires that the platform be responsive to different needs for data in different combinations.
Customising the views was made possible by locating a setting panels that could be used to change the metrics for heat maps and other representations, very quickly.
-
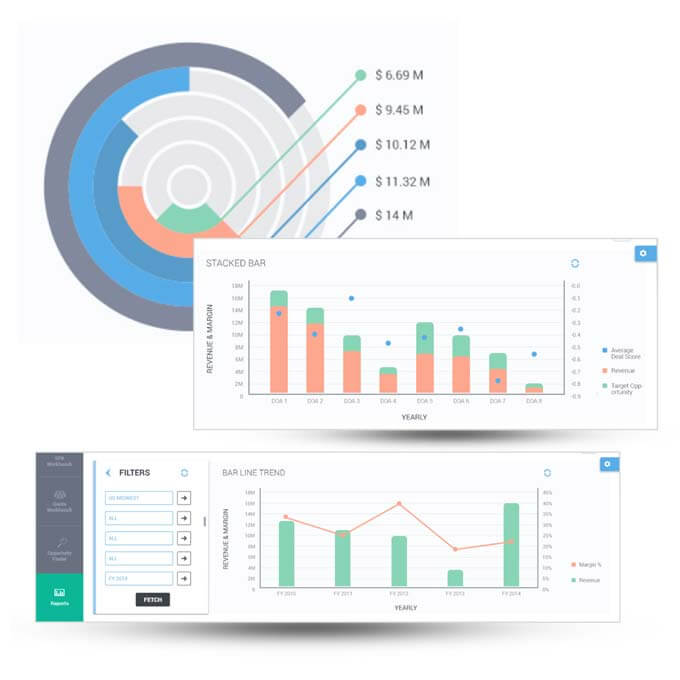
DATA MODELLING &VISUALISATION
The platform works with millions of data points, analyses them and provides actionable insights. We designed mature data modelling system to work with this data.
Data visualisation is an important part of data analytics which allows users to effectively extract insights from millions of inputs. Effective display helps in cutting down cognitive load on the users.
-
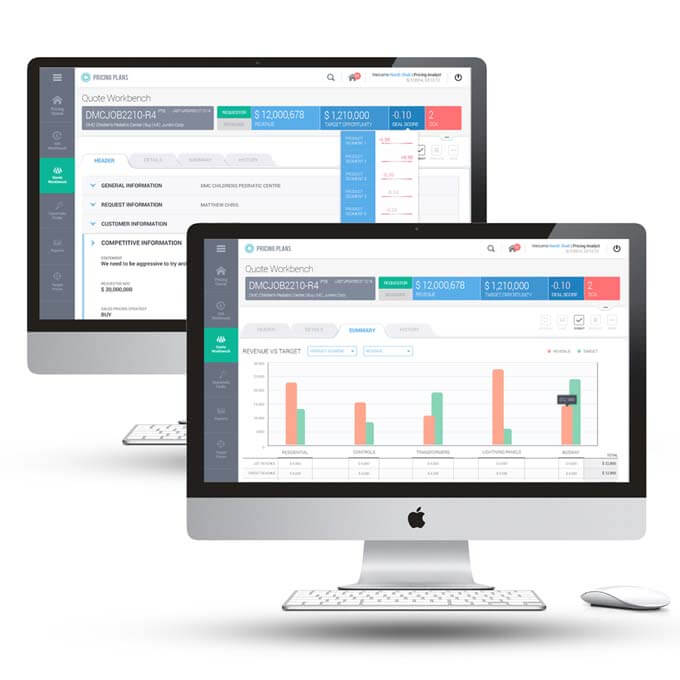
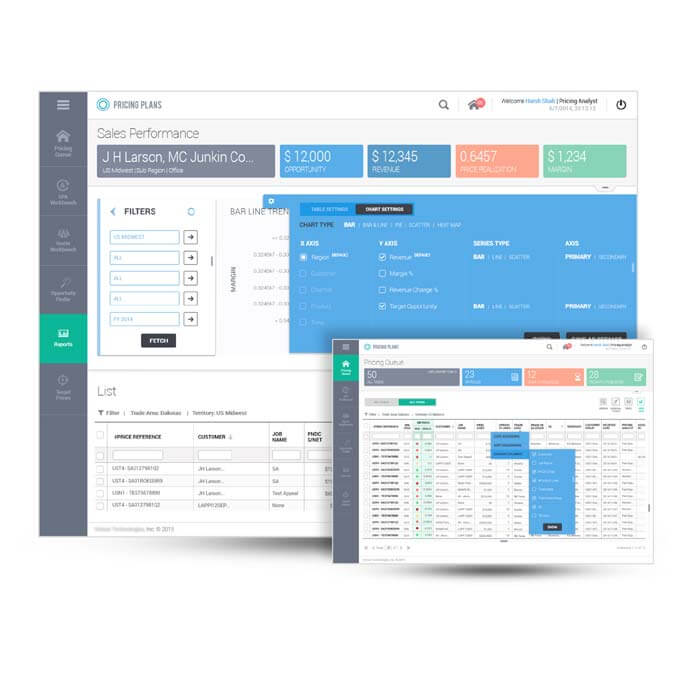
QUOTE WORKBENCH
The primary working area of the user has been designed so as to provide him with all the information he needs for a particular contract to be able to make informed decisions. Each metric can be drilled down to get details at a more granular level.
An overall summary helps him keep an eye on the impact of every variation made while working on the quotes. Summaries can be viewed across multiple variables. The maker-checker paradigm is addressed by a simple toggle at the top which realigns information based on the role of the user
-
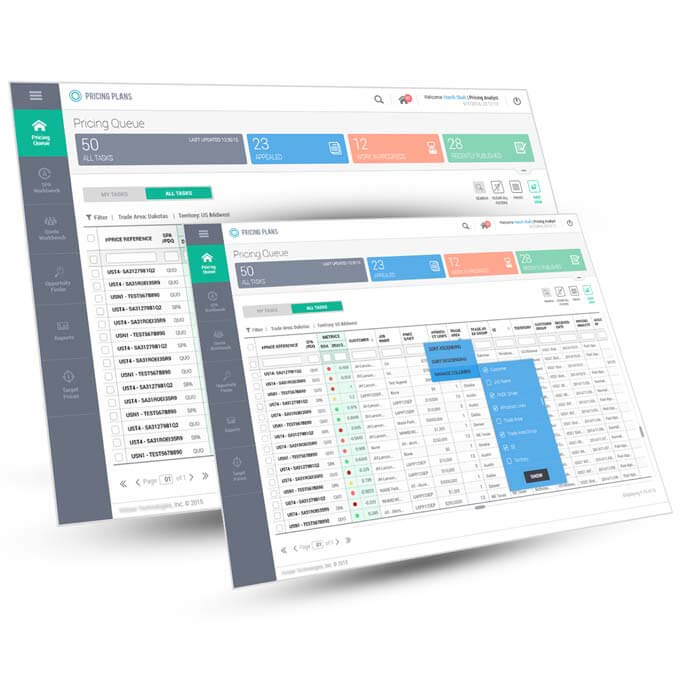
PRICING QUEUE
The pricing queue dashboard is designed to give the user as much data as possible against each task. The data points can be varied by applying filters. He can choose which columns he wants to see A colour coded summary gives the user an overview of the status on various tasks.
Since working on each quote is a long and tedious process, we gave the user the ability to save work views and move between tasks based on urgencies. Each column also has a sorting feature. All these tools are aimed at making the pricing queue as customisable as possible.

-
 0
cups of coffee
0
cups of coffee
-
 0
blinks per hour
0
blinks per hour
-
 0
laptop charges
0
laptop charges
-
 0
social gatherings ignored
0
social gatherings ignored
-
 0
hours of travel
0
hours of travel